INNER-INVESTOR OUTLOOK JANUARY 2014
US EQUITIES OUTLOOK:
2013 was a great year for the stock market. Ongoing inflows of QE money and the improving economy were certainly a help. The year ended on a high note even after the FED told us that QE3 would be winding down in 2014.
The major cyclical bull market that started in 2009 remains intact, but the momentum of the SP500 index suggests that the S&P (and the DJIA) will likely have a correction earlier in the year rather than later.
We remain bullish on US equities but are watching closely because the picture is starting to look murkier compared to last year.
US EQUITIES TECHNICAL ANALYSIS:
Rather than try to predict the unpredictable, however, it’s important to understand the basics of investing and the AlgoTrades philosophy.
How to be a successful investor:
1. Follow the market’s trend and trade with it. There is a natural tendency for humans to be bearish in a raging bull market and to be bullish during bear markets.
Everyone wants to be a hero by picking the top or bottom while making a fortune at the same time. Unfortunately investing success does not happen that way unless you get really lucky.
Instead, we follow the intermediate trend which we will show you in each month’s issue using our INNER-Investors Analysis.
2. Do not trade or invest based on forecasts. Our BIG PICTURE analysis shows you what is possible on both sides of the spectrum (bullish and bearish). Knowing what could happen in the coming year should be used as a mental thermostat to help you keep your cool when things get volatile.
This analysis is to help calm your nerves and allow you to ride trends longer. Knowing which trend the market is in prevents you from second guessing your trades and trying to pick tops and bottoms. The information we offer is a tool to help you make money and strengthen your self-discipline.
LONG TERM BEARISH OUTLOOK:
January is always a good time to review the big picture of the stock market.
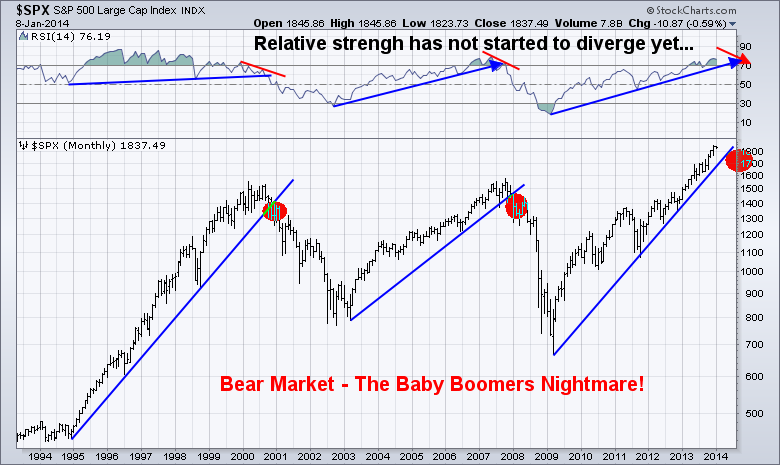
The chart below shows a basic analysis of very powerful trends in the market. As long as price remains above the multi year trend line in the chart, we can expect this cyclical bull market to continue. A break of this trend line will trigger a multi year consolidation or a full blown bear market.
I don’t think the United States can handle another bear market yet. That said, there is nothing we can do about it other than watch it happen and make sure we profit from falling prices.
“Stock prices fall 3-7 times faster than they rise.
Huge money can be made during a bear market it traded properly.”
US MARKET INDICATORS:
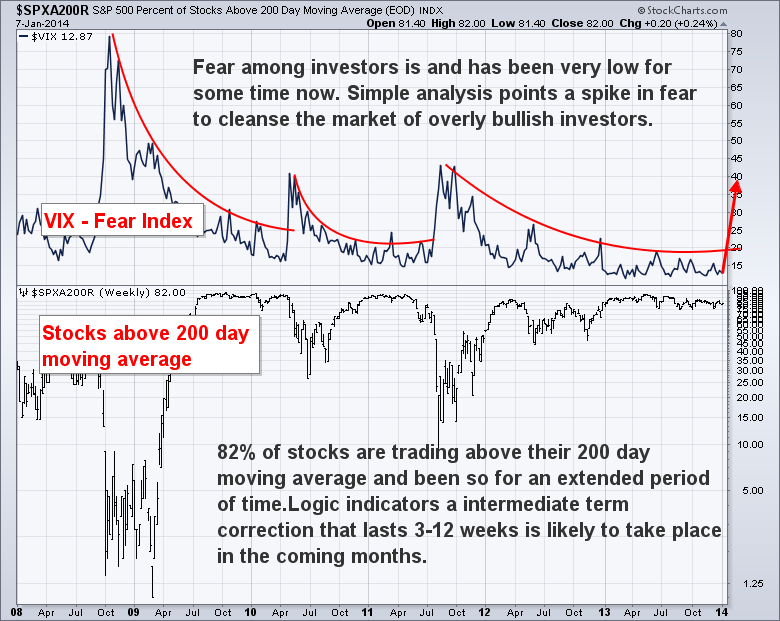
The VIX index has been trading at low levels during 2013. This suggests that fear is low, complacency is high, and that SP500 has become vulnerable. If prices start to break down, a wave of panic selling might hit the broad market.
In the chart below, I have placed the VIX index above the SP500 index to show how many stocks are trading above the 200 day moving average. Currently, 82% of stocks in the S&P 500 are in an up trend and trading above their 200 day simple moving average.
This provides a great visual of how falling markets correlate with investor fears. While overall market breadth remains strong, a change in the VIX often provides an early warning sign of potential danger.
“When The VIX Is Low Its Time to Go, When The VIX Is High Its Time To Buy”
THE FLOW OF LEVERAGE (MARGIN):
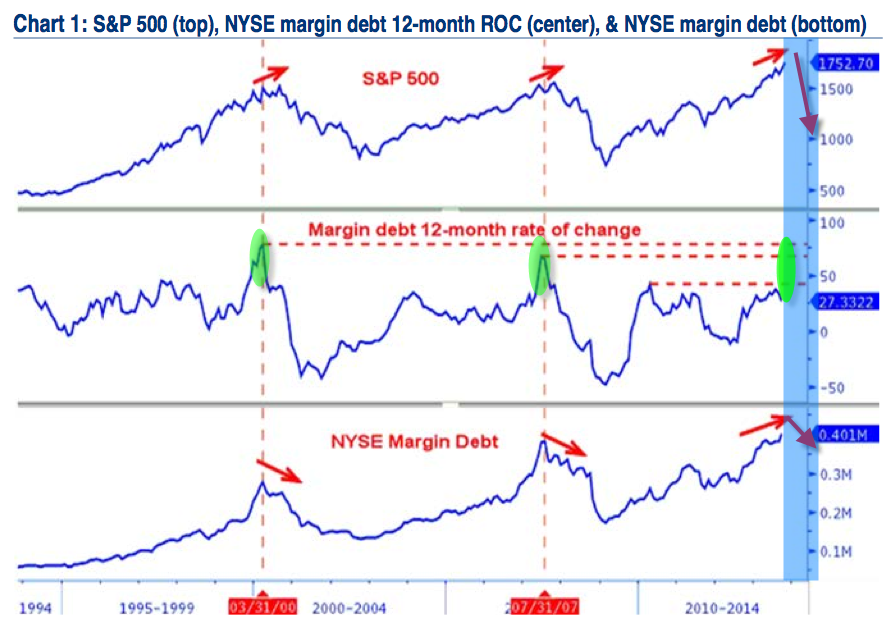
The indicator chart below from BofA Merrill Lynch shows three separate indexes (sets of blue lines). The top is the SP500, the middle is the ROC (rate of change indicator) based on margin debt, and the bottom is the NYSE margin debt level.
These charts indicate that investors are taking on more equity debt than ever before. We are not seeing any sign of divergence between margin levels and the SP500 index yet so higher prices are likely to continue for now.
Until the middle indicator (rate of change) has a capitulation spike higher yet, I believe the investing masses have not all jump on the long (bullish) band wagon to form a market top.
Before the NYSE margin debt reached a new high, Deutsche Bank said on August 13, 2013: “Investors have rarely been more levered than today.”
Deutsche also warned that the spike in margin debt is a “red flag” and should be watched closely and said that the equity rally may have further legs. However, it also warned about “astonishing similarities between the latest patterns and the last market crises.”
Individual investors, private equity firms and hedge funds are all using leverage in record amounts. The margin level at brokerage firms are at an all-time high. Leveraged buying by institutions and margin buying by individuals explains how the averages have managed to rise dramatically in the last year. It looks like another debt-financed bubble to me.
LONG TERM BULLISH OUTLOOK:
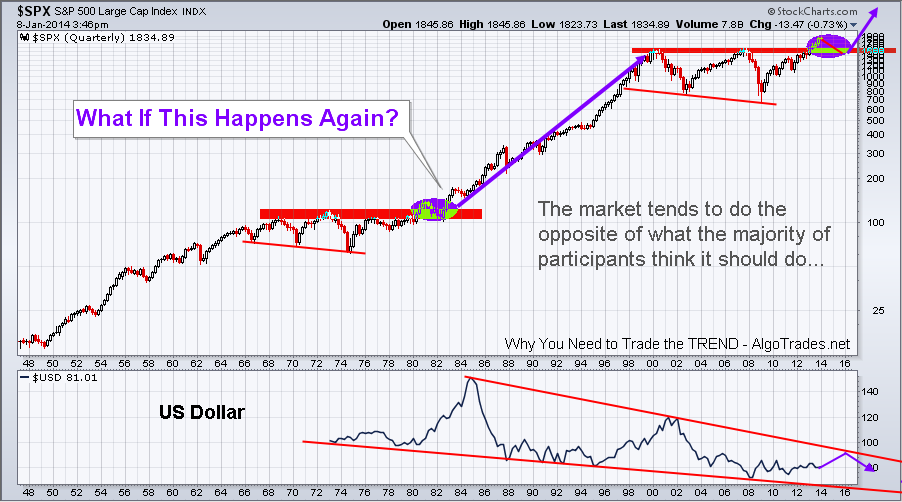
This is the scenario I would love to see unfold in the next 6-8 years. This would truly give the baby boomers some golden years if their money is still in equities.
This chart is forecasting a 2-3 year correction (consolidation) to start in 2014. The market could trade sideways or lower by roughly 15 – 20% before starting another major bull market. This would not be a market crash, but a tamed bear market similar to what occurred in 1981- 1983.
A pullback in equities would likely be triggered by the unwinding of QE3, rising interest rates and a rising dollar. The dollar index is shown at the bottom of this chart, with the purple line showing my expectation for the long run.
US DOLLAR INDEX:
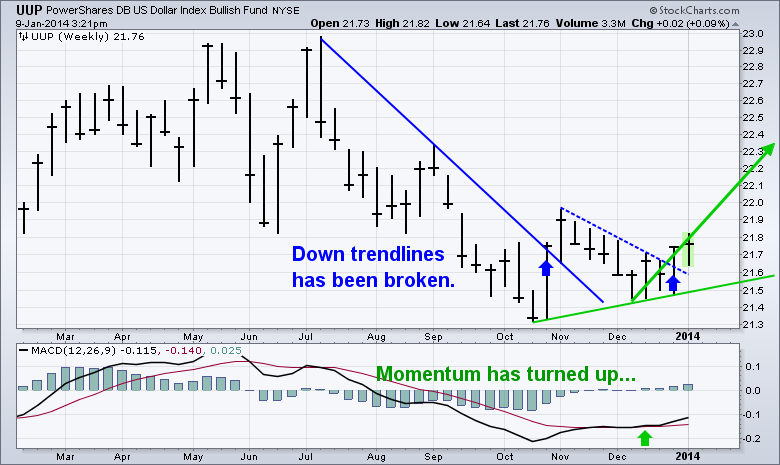
Overall it was a tough second half of 2013 for the greenback. But 2014 could be setting up for a big move higher now that QE3 is winding down, corporate earnings are growing, and interest rates may be rising.
CANADIAN EQUITIES:
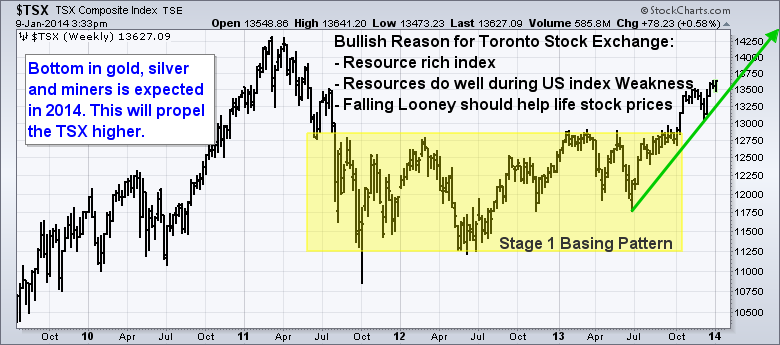
Corporate profits in Canada are apt to be partially tied to the price of gold, silver, oil, natural gas, grain, and timber. Gold, silver and gold miners are expected to bottom this year and that would help make 2014 a decent year for Canada.
TSX Composite is resource-weighted and Canadian stocks lagged their counterparts around the world last year. Canadian equities are not as overextended as many think and may hold up well in a global correction.
Because of the TSX’s higher weighting in late-cycle sectors (resources), it’s not unusual for Canadian stocks to lag in the early stages of a bull market, catch up in the late stages, and outperform toward the end.
CANADIAN EQUITIES CHART:
ALGOTRADES 2014 INVESTING OUTLOOK CONCLUSION:
This first issue is more of an outlook of what to expect this year. In the next issue we will present market cycle analysis and our INNER-Market Analysis.
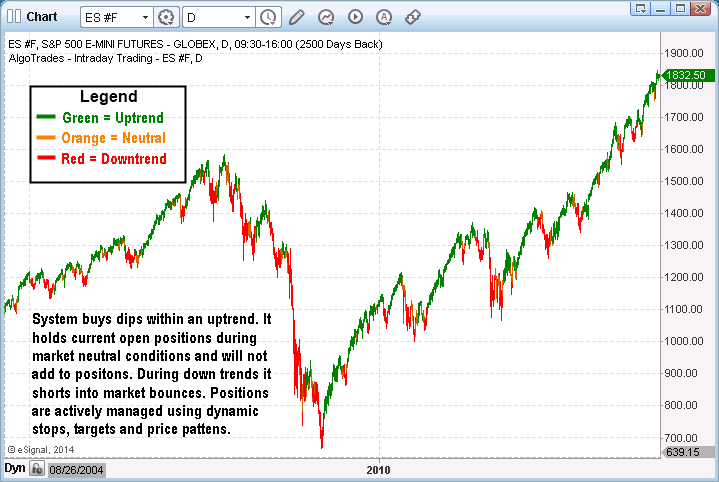
Success in 2014 looks as though it will require more effort than in 2013. While the uptrend remains firmly intact and we continue to buy dips, a looming market correction could create some wild price whipsaws that only active investors following the intermediate cycles and trends are likely to navigate profitably.
There are two ways to play this:
1. Move to cash once the trend and technical turn negative and wait for a bottom.
2. Move to cash once the trend turns down and actively trade the correction for quick oversized gains.
3. Have a portion of your investment capital traded for you to make make money no matter the market condition with our Algorithmic Trading Systems.
We can profit in both bull and bear markets. By taking advantage of falling prices we can make money from the market when most are losing money.
Profiting in a falling market is exciting. The feeling of accomplishment compensates for the otherwise negative event. But you need a special strategy that can make money in a down market. You also need a strong level of self-discipline, as falling prices and rising volatility (Fear/VIX) heightens emotional levels.
This monthly investing newsletter will provide you will the current market trends and technical outlooks (forecasts) to help keep you on the right side of the market.
No matter what your investment experience is our how much capital you have to invest, AlgoTrades is here to help you. We love hearing from you so don’t be shy about sending us an email with your feedback.
Sincerely,
Chris Vermeulen Founder of AlgoTrades.net

